Birchwood Middle School
What is Lunchroom Waste made up of?
Chart 1 shows that most of lunchroom waste is food waste.
By sorting, recovering, recycling and composting, look at how much we have reduced the amount of waste going to the landfill!
Chart 2 shows the five waste components – Recoverable Food, Liquids, Recycling, Landfill and Food Scraps.
What categories of waste are the biggest?
In what ways can we reduce them?
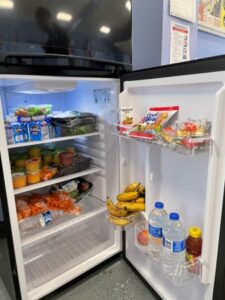
Recovering Food at the Share Table & Refrigerator.
Perfectly good, unopened or untouched food gets collected on the share table. This food used to go to the landfill.
Using safe food handling guidelines, we collect and offer share table food to students who are still hungry and sometime local food pantries.
According to “Leftover Cuisine,” a food rescue organization, one meal is calibrated as 1.2 lbs. of recovered food.
Look at how many meals we have provided by recovering food at the share table!
Food Recovered: 1034.4 lbs.
Meals Created: 861.66
Environmental Impact
As we divert food waste from the landfill and reduce food waste per student, we are reducing greenhouse gas emissions and saving resources.
We calculate these reductions in Metric Tons of C02 and we can how this improves the environment by using the Greenhouse Gas Equivalencies Calculator | US EPA .
Check out what your school is doing for the planet!